Six Indian States Above Global Average As Wind And Solar Reach A Record 12% Of Global Electricity In 2022
Data reveals that over sixty countries now generate more than 10% of their electricity from wind and solar

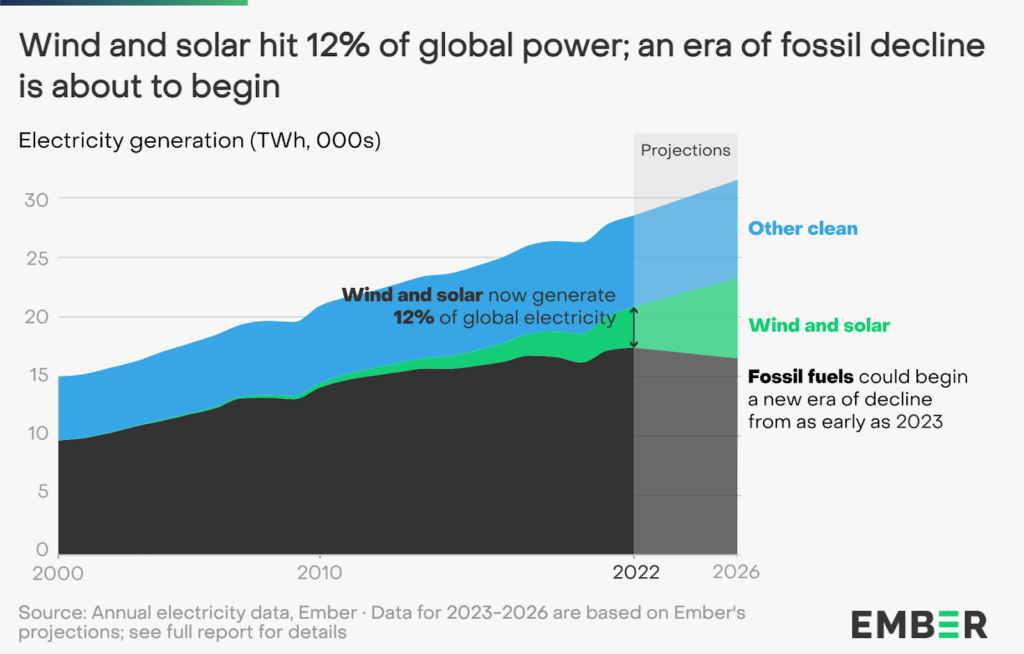
Wind and solar reached a record 12% of global electricity in 2022, up from 10% in 2021, according to a major report launched today by energy think tank Ember. In India, the combined share of wind and solar reached 9% (165 TWh) in 2022. However, six Indian states were above the global average in 2022, led by Goa (78%), Rajasthan (36%), Gujarat (30%) and Karnataka (28%). The data reveals that over sixty countries now generate more than 10% of their electricity from wind and solar.
The fourth annual Global Electricity Review from energy think tank Ember presents electricity data from 2022 across 78 countries, representing 93% of global electricity demand. The open data and in-depth analysis provide the first accurate picture of the global electricity transition in 2022. The data reveals that over sixty countries now generate more than 10% of their electricity from wind and solar.
Combined share of wind and solar electricity in India’s six states that were above the global average in 2022
See full dataset and methodology for all states and union territories
| States | Share of wind and solar (%) |
| Goa | 77.95 |
| Rajasthan | 35.93 |
| Gujarat | 29.76 |
| Karnataka | 27.52 |
| Tamil Nadu | 22.2 |
| Andhra Pradesh | 19.12 |

For the eighteenth consecutive year, solar power has maintained its position as the fastest growing source of global electricity with a year-on-year growth of 24%, adding enough electricity to power all of South Africa. Wind generation increased by 17% in 2022, enough to power almost all of the UK. In India, while solar generation showed a remarkable increase of 39% (+27 TWh), growth in wind power was weaker at 2.9% (+2 TWh).
India’s clean power growth needs to pick up pace to keep up with fast-rising power demand
The growth in wind and solar generation in 2022 met an impressive 80% of the rise in global electricity demand. However, the rise in wind and solar generation in India was only enough to meet a quarter of the increase in demand.
Up by 7.2%, (+124 TWh), India’s power demand increase outpaced its average annual demand growth rate in the last decade (+5.7%) amid an economic rebound from the Covid-19 pandemic. This was three times higher than the global average of 2.5% and resulted in a corresponding increase in fossil fuel generation by 5.8% (+78 TWh). In 2022, India generated 77% (1,415 TWh) of its electricity from fossil fuels. Coal had the largest share at 74% (1,363 TWh), followed by gas at 2.7% (50 TWh), and other fossil fuels at 0.1% (2.4 TWh).
In comparison, global increases in fossil fuels were limited. In spite of the global gas crisis and fears of a return to coal, the rise in wind and solar limited the increase in global coal generation, which rose by 1.1%. Global gas power generation fell very slightly (-0.2%) in 2022. Overall, that still meant that global power sector emissions increased by 1.3% in 2022, reaching an all-time high. India’s emissions rose even faster, increasing by 6.4% year-on-year and adding 70 million tonnes of carbon dioxide, almost half of the global increase (+160 million tonnes).
Ember’s senior electricity policy analyst, Aditya Lolla, said:
“India’s clean electricity transition journey has now reached a critical juncture. The country needs to build upon its recent solar power surge. It needs to ramp up renewable generation capacity to meet its growing demand, build enough storage capacity to meet peak demand and develop infrastructure to facilitate grid integration. These are all big challenges but they need to be addressed for India to achieve its 500 GW non-fossil capacity by 2030 and ensure its coal-fired generation is closer to peaking.”
Institute for Energy Economics and Financial Analysis’ Director – South Asia, Vibhuti Garg, said:
“India has made remarkable progress in its electricity transition journey with the share of renewable energy increasing in total installed capacity. However, the share of renewable energy in total generation also needs to increase at an accelerated pace. For this, India needs to scale up deployment of flexible generation sources, modernise and digitalise its grid and also build in price signals through time of day pricing. Furthermore, policy certainty is key to boost investor confidence as India needs around US$400-500 billion of capital to meet its 2030 clean energy target.”
Experts forecast that global power sector emissions have peaked
The report forecasts that last year may be the ‘peak’ of electricity emissions and the final year of fossil power growth, with clean power meeting all demand growth in 2023. As a result, there would be a small fall in fossil generation (-0.3%) in 2023, with larger falls in subsequent years as wind and solar deployment accelerates.
“In this decisive decade for the climate, it is the beginning of the end of the fossil age,” said the lead author, Małgorzata Wiatros-Motyka. “We are entering the clean power era.”
According to modelling by the International Energy Agency, the electricity sector needs to move from being the highest emitting sector to being the first sector to reach net zero by 2040 in order to achieve economy-wide net zero by 2050. This would mean wind and solar reaching 41% of global electricity by 2030, compared to 12% in 2022.
Ember’s senior electricity analyst, Małgorzata Wiatros-Motyka, continued:
“The stage is set for wind and solar to achieve a meteoric rise to the top. Clean electricity will reshape the global economy, from transport to industry and beyond. A new era of falling fossil emissions means the coal power phasedown will happen, and the end of gas power is now within sight. Change is coming fast. However, it all depends on the actions taken now by governments, businesses and citizens to put the world on a pathway to clean power by 2040.”
Key data table of global electricity generation in 2022 vs 2021
For the full dataset, including country-level and historic data, please see the Media Pack
2022 | 2021 | Year-on-year change | |
| Share in the electricity mix, %(Generation, terawatt hours) | Change in generation, terawatt hours(as a percentage) | ||
| Solar | 4.5%(1,284 TWh) | 3.7%(1,039 TWh) | +245 TWh(+24%) |
| Wind | 7.6%(2,160 TWh) | 6.6%(1,848 TWh) | +312 TWh(+17%) |
| Hydro | 15%(4,311 TWh) | 15%(4,238 TWh) | +73 TWh(+1.7%) |
| Coal | 36%(10,186 TWh) | 36%(10,078 TWh) | +108 TWh(+1.1%) |
| Gas | 22%(6,336 TWh) | 23%(6,348 TWh) | -12 TWh(-0.2%) |
| Nuclear | 9.2%(2,611 TWh) | 9.9%(2,739 TWh) | -129 TWh(-4.7%) |
| Bioenergy | 2.4%(672 TWh) | 2.4%(666 TWh) | +5.5 TWh(+0.8%) |
| Electricity demand | 28,510 TWh | 27,816 TWh | +694 TWh(+2.5%) |
The link of report :
https://ember-climate.org/insights/research/global-electricity-review-2023
The writer of this article is Dr. Seema Javed, a known Environmentalist, Journalist and Communications Expert


